What I learned in 3 hours about doing great data journalism at the New York Times and ProPublica

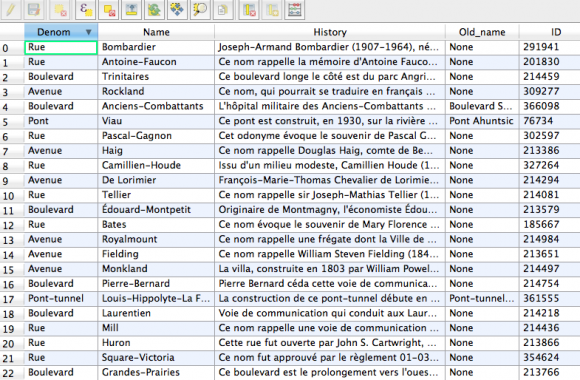
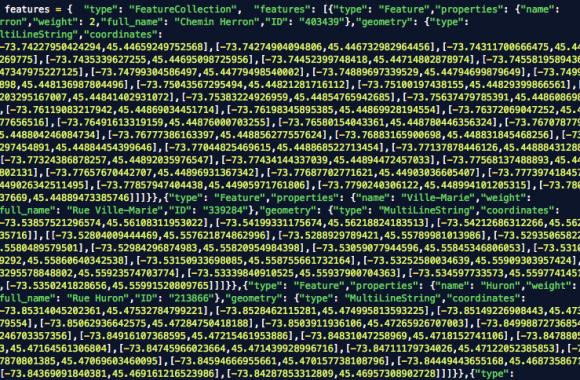
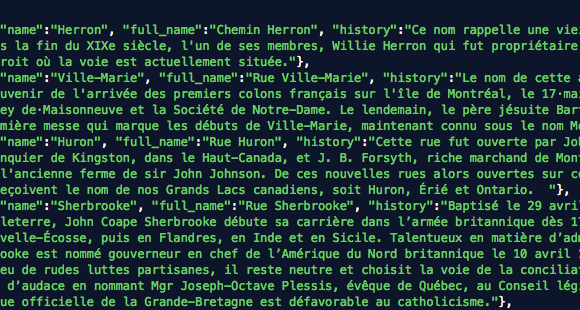
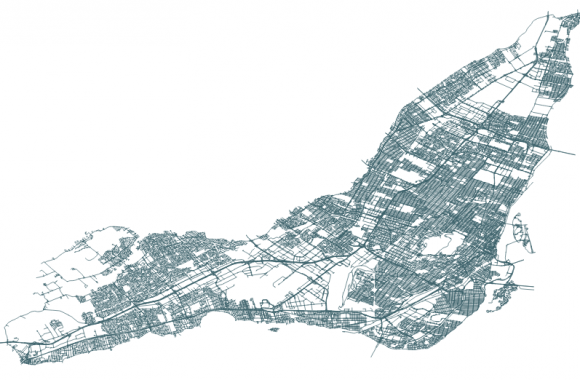
This post originally appeared on Medium. I was fortunate to take part in the Data Journalism Unconference hosted by Global Editors Network in New York this week. Attendees had the option of visiting two newsrooms for a “study tour” of their data teams. I chose the New York Times and ProPublica, two publications I admire. […]

It’s foolish to rank psychedelic drugs, but I’m going to try anyway

Erowid.org is a website with an overwhelming amount of information about drugs. It curates scientific literature, legal documents, cultural uses, and user experiences on all kinds of substances. It’s well known among those who use psychoactive drugs for self-exploration. I like to call it Encyclopaedia Psychonautica. One of the more interesting sections of the website is the […]

A look at Canada’s international trade through maps and charts

Canada has trade relations with 224 countries and territories, with which it trades more than 5,500 types of products and services. In 2014, Canada imported $511 billion in goods, and exported $525 billion, according to data from Statistics Canada. But who are our main trading partners, and what kind of goods flow back and forth […]

How I made the Montreal street history map

Click here to see the map at Huffington Post Québec First of all, a clarification. I did not really make that map. I adapted the code from Noah Veltman’s San Francisco history map, and made one for Montreal. Compare both maps, and you’ll see they are very similar in many ways. That said, the data sources […]

The best PyCon 2015 videos for journalists

PyCon is the world’s biggest conference for Python programmers, with great talks for both veterans and newcomers. And every year, organizers publish videos of talks and workshops for free for all to enjoy. Here is my selection of videos from this year’s conference in Montreal that I believe are of value for journalists who use […]

Making an interactive choropleth map with Jqvmap and Geostats

See the live map here. Jqvmap is an excellent JavaScript library for making sleek D3-style interactive vector maps quickly and easily. However, its suggested technique for visualizing data (see the library’s documentation) leaves something to be desired. This post suggests another way, using Geostats, another excellent JS library. To be clear: jqvmap’s dataviz technique works, […]

Using Python’s calendar module for scraping date-based data

I’ve recently fallen in love with Python’s standard calendar module. It has lots of functions to make handling dates a breeze. And for scraping data based on dates, it couldn’t be more convenient. Take Environment Canada’s historical hourly data for Montreal. Each page has 24 hours of data in a single day. If I want […]

How to survive the desert of despair in your code-learning journey

A lot of ink has been devoted lately on reality checks for new self-taught coders. Here are two prominent posts: TechCrunch: Don’t Believe Anyone Who Tells You Learning To Code Is Easy Viking Code School Blog:  Why Learning to Code is So Damn Hard These posts are reactions to the wealth of beginner courses on coding, some which promise […]