Jqvmap is an excellent JavaScript library for making sleek D3-style interactive vector maps quickly and easily. However, its suggested technique for visualizing data (see the library’s documentation) leaves something to be desired.
This post suggests another way, using Geostats, another excellent JS library.
To be clear: jqvmap’s dataviz technique works, but it’s not appropriate for ever kind of data. It first finds the maximum and minimum values, then does some complicated math to split the range into different colour classes and assign hex colour codes to each feature.
If your data has a big range, with most countries clustered around one end and a few outliers in the other, the colours won’t look good.
Enter geostats
Geostats is a JS library that does math on your data so you don’t have to. It calculates all sorts of stats (like max and min) and splits your data into intervals for effective colouring.
People familiar with GIS will recognize these intervals: Jenks breaks, equal intervals, quintiles, etc. Switching between them is easy, so you can experiment with different colour classifications.
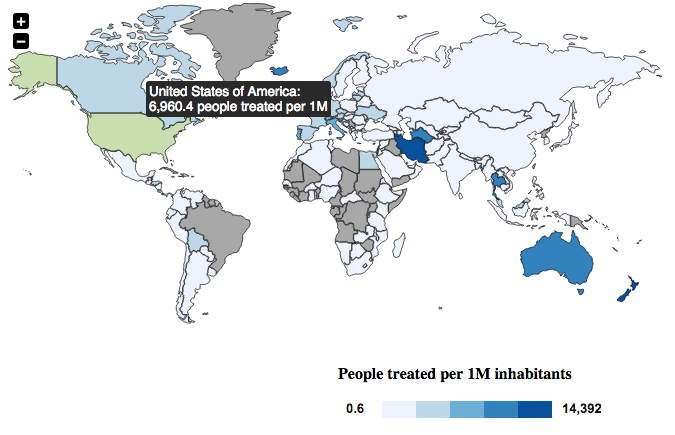
For this example, we’ll use jqvmap’s world map and data from the UN Office on Drugs and Crime on people treated for drug abuse (Treatment demand, under “Drug use”). The data has been converted to JSON using Shan Carter’s handy Mr. Data Converter tool, and normalized by population using World Bank data.
The data should look like this, with the jqvmap country codes as keys:
var data = {
  "er": 9.1,
  "et": 17.9,
  "ke": 17.9,
  "mg": 13.7,
  "mu": 1112.2,
  "sc": 2433.1,
 ...
};
First, load jQuery, Jqvmap and Geostats. I used an updated map made by GitHub user steelcrashed that includes new countries like South Sudan and Macedonia.
<script src="http://ajax.googleapis.com/ajax/libs/jquery/1.7.2/jquery.min.js" type="text/javascript"></script>
<script src="lib/geostats.min.js" type="text/javascript"></script>
<script src="lib/jquery.vmap.js" type="text/javascript"></script>
<script src="lib/jquery.vmap.world-update.js" type="text/javascript"></script>
Create an array of colours. I use ColorBrewer for palette suggestions.
var hexes = [
 '#eff3ff',
 '#bdd7e7',
 '#6baed6',
 '#3182bd',
 '#08519c'
 ];
You need to feed Geostats your data as an array. I do this by iterating through the JSON and filling the array.
var dataValues = [];

for (var country in data) {
   var countryValue = data[country];
   if (countryValue > 0 ) {
     dataValues.push(countryValue);
 };
Create a Geostats objects and feed it your data. Choose with classification method you want and the number of intervals. In this case, I chose Jenks breaks on six intervals.
var geoSeries = new geostats(dataValues);
var jenks = geoSeries.getClassJenks(5);
Here’s what the intervals look like:
> jenks
[0.6, 606.1, 1881.9, 4141.5, 9168.4, 14392]
Now we loop through our data and assign colours to the Jqvmap colors object. Null values were assigned a 0 in my data, so they get a grey colour for no data.
var colors = {};
for (var country in data) {
   if (data[country] > 0) {
      for (var i = 0; i <= 4; i++)  {
          if (data[country] >= (jenks[i]) && data[country] <= (jenks[i + 1])) {
              colors[country] = hexes[i]
	      }
       }
   }  else { colors[country] = '#A8A8A8' };
};
Now initiate your map, add whatever parameters you want, and the ‘colors’ object as the colors, and voila.
$('#vmap').vectorMap({
    map: 'world_en',
    backgroundColor: 'white',
    borderColor: 'black',
    borderOpacity: 0.9,
    colors: colors
 });

// Make sure to create the right div for the map in the HTML body
// <div id="vmap" style="width: 700px; height: 400px;"></div>
The full, functional map can be found here.