Montreal, Québec, Canada

Roberto Rocha

Data storyteller and educator

Menu
  • Home
  • CV
  • Blog
  • Data services
  • Training
  • Contact

Google Sheets

image image-1 image-2 image-3 image-4 image-5 image-6 image-7 image-8 wMQlF-tracking-quebec-s-covid-19-curve

4 ways to make self-updating Datawrapper charts

August 10, 2021August 11, 2021 Roberto 0 comments

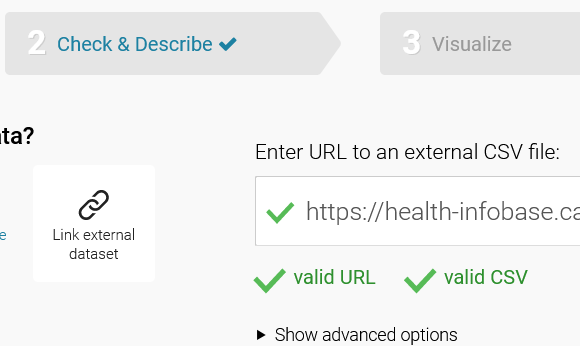
Datawrapper is right now the best tool for creating quick and simple charts. It’s so useful and feature-rich that news organizations that had their own in-house charting tool are switching over. One of its best features is the ability to connect a CSV file hosted on the web as a data source. This enables users […]

Posted in Data Journalism, Tutorials Tags automation, dataviz, datawrapper, Google Sheets, Python
Read More

Recent Posts

  • Pair programming with LLMs: putting 5 leading models to the test
  • How to use ChatGPT Vision to turn handwritten forms into data
  • Using ChatGPT to clean data: an experiment
  • How to extract entities from raw text with Spacy: 3 approaches using Canadian data
  • Getting tabular data from unstructured text with GPT-3: an ongoing experiment

Recent Comments

  • Aditya Sharma on Using Python’s calendar module for scraping date-based data
  • Jed Clark on Using NLP to analyze open-ended responses in surveys
  • Roberto on Using ChatGPT to clean data: an experiment
  • Chris on Using ChatGPT to clean data: an experiment
  • Jacques Dufort on Using NLP to analyze open-ended responses in surveys
Theme: Albar by Kaira